What happened in the oil and petrochemicals market during Q2 2021 was nothing short of a thriller with totally unexpected turns of events. Were it ever to be made into a film, the story could be based on the deep-dives that SIBUR experts made; having scrutinised the rise in freight rates, surprise news from Europe and anti-dumping duties in their reports.
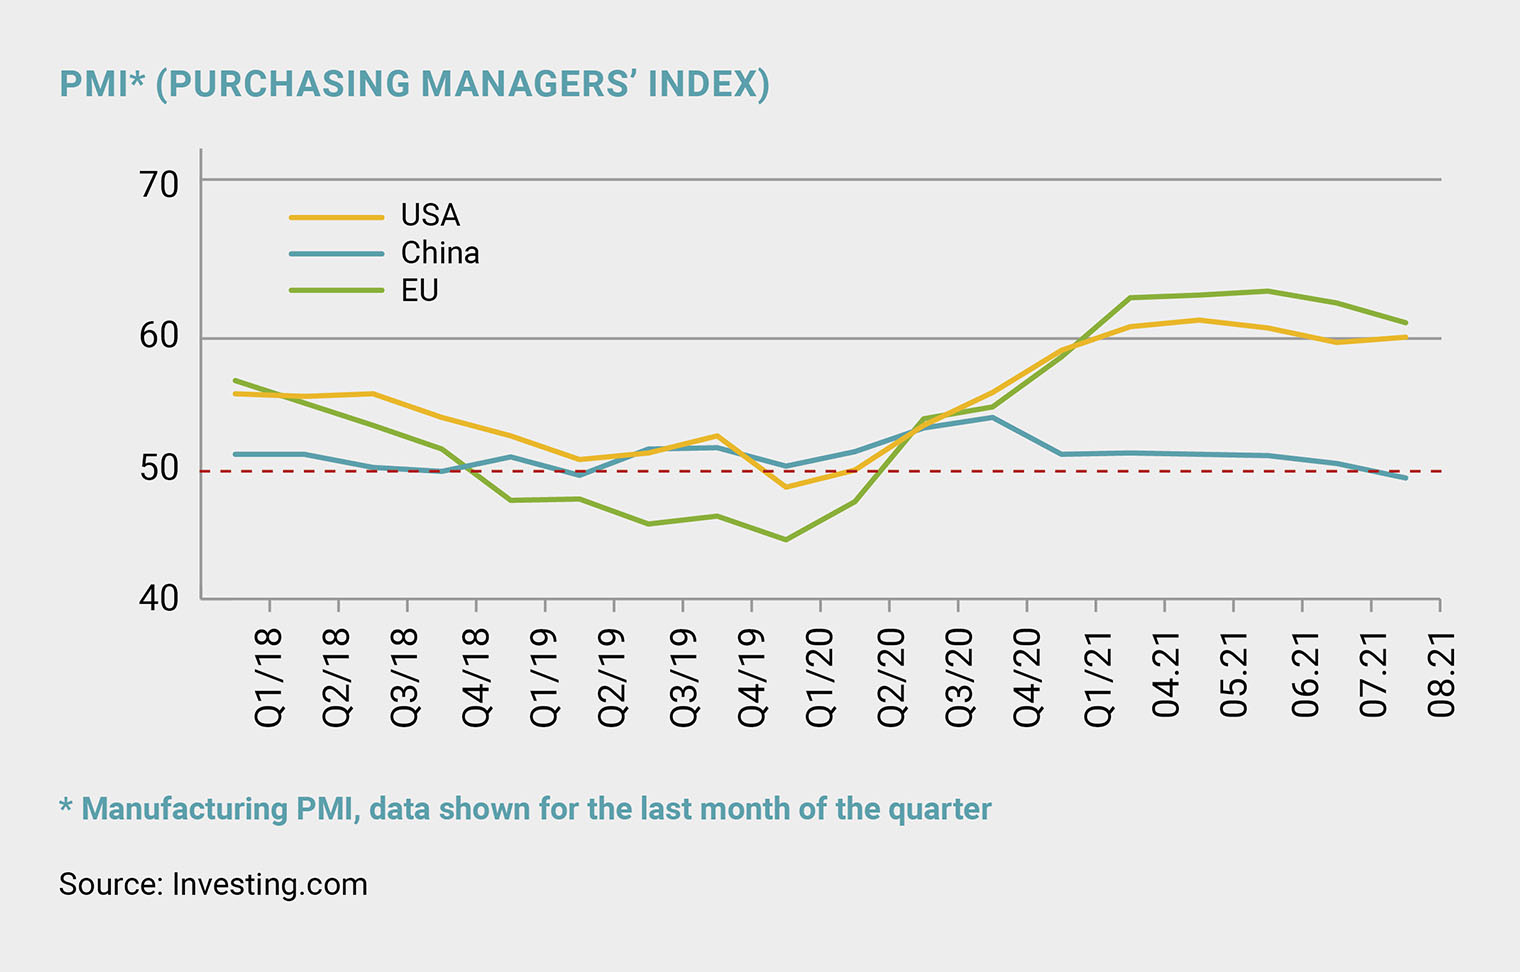
Business activity: PMI 50+
In Q2 2021, the market environment was similar to the first quarter. Despite high case rates, the post-pandemic recovery was ongoing. As a consequence, the Purchasing Managers’ Index (PMI) in the US, EU and China exceeded 50. The government of China, where PMI was the lowest, decided to launch another stimulus package by planning to release around 1 trillion yuan (USD 154.19 billion) worth of liquidity into the economy through a 50-basis-point cut to the reserve requirement ratio (the amount of cash that banks must hold as reserves).
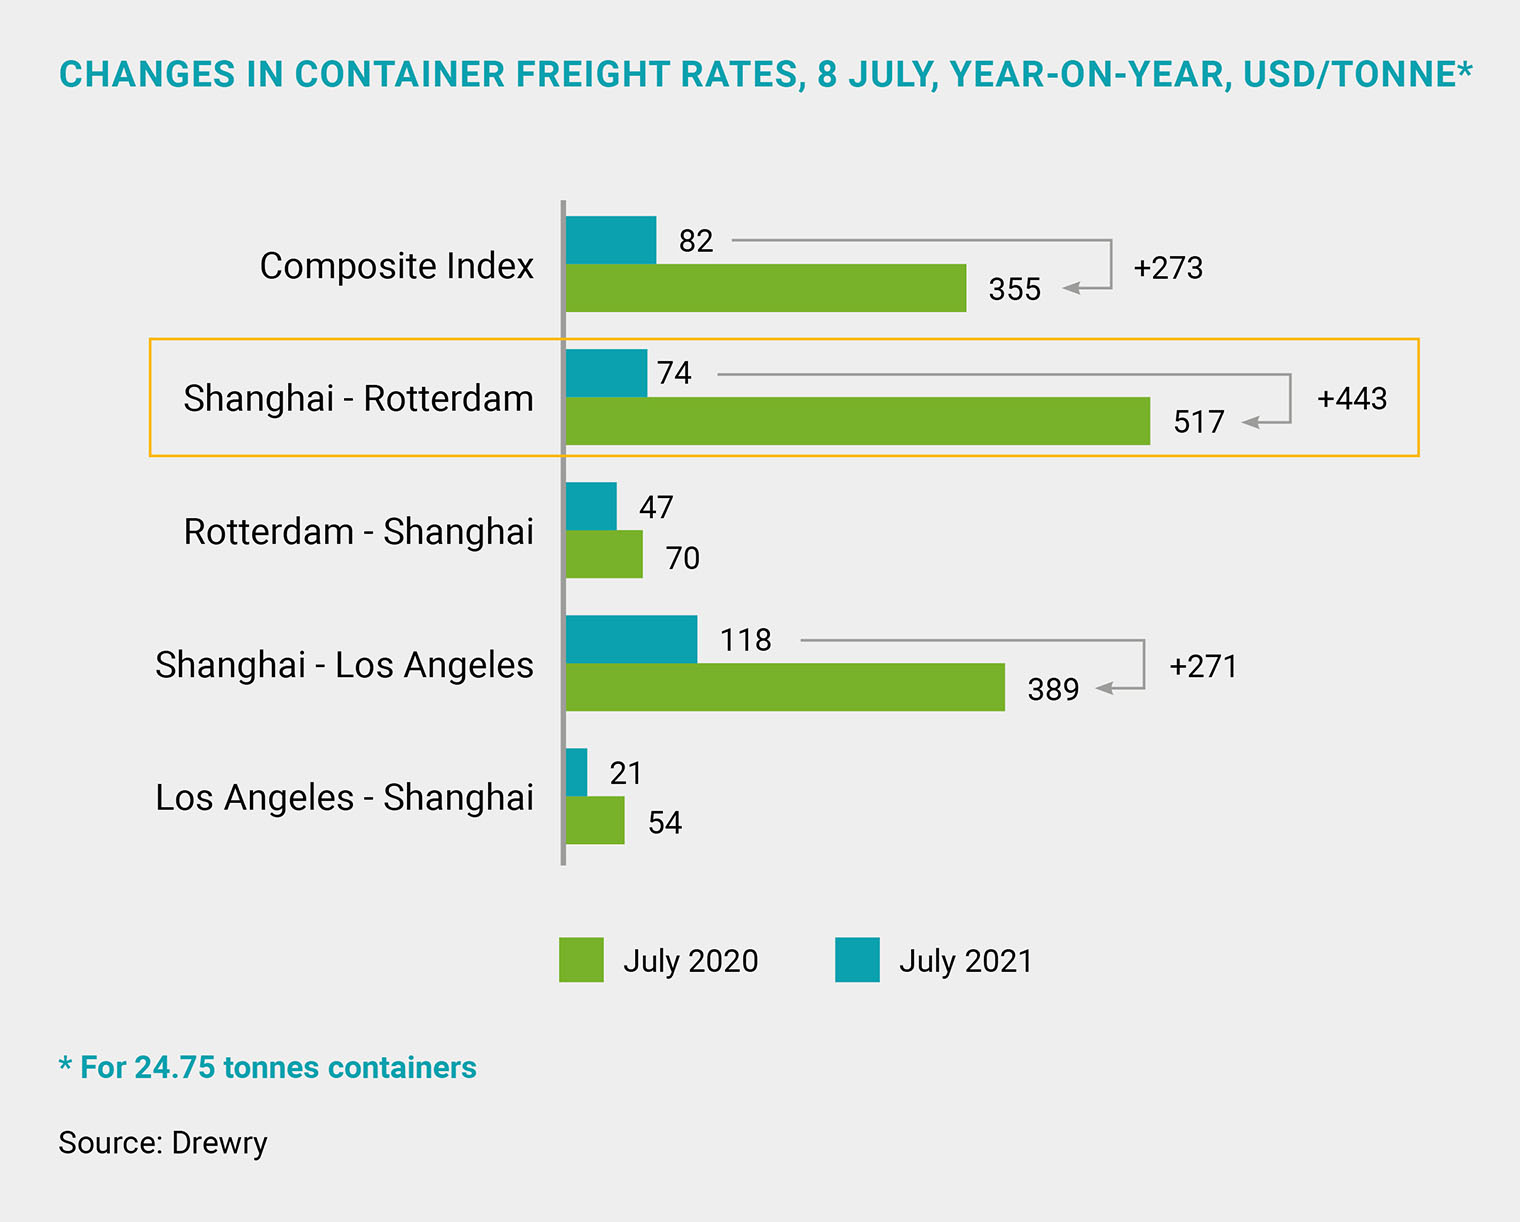
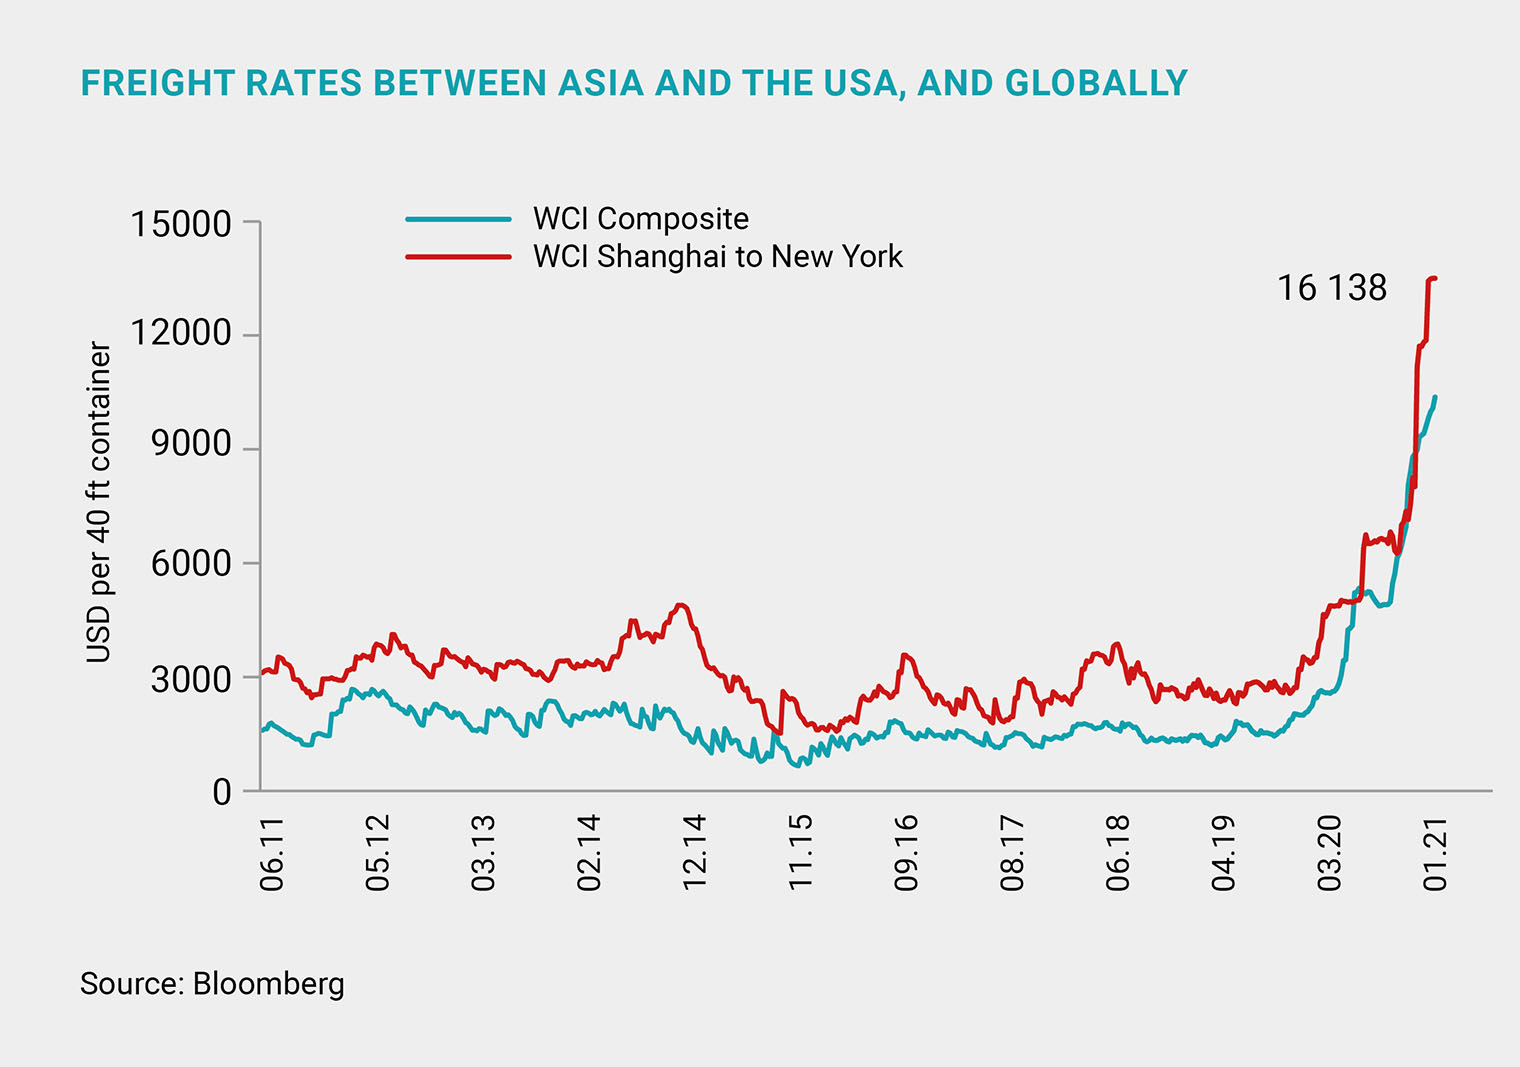
With their supply chains hit by the crisis, producers have undertaken an inventory restocking phase for fear of supply shortages. The global shortage of shipping containers sent shipping prices soaring. For destinations from Asia to Europe and the USA, shipping prices have increased three to five times from the last year (for more details, see below). Increased delay times also continued to be an issue, which led to imbalances between demand, supply and pricing for many petrochemical products in Europe, Asia and the USA. Analysts expect that logistical problems will persist until at least year-end 2022.
Oil market: Brent + 12%
The Purchasing Managers’ Index (PMI) in the US, EU and China exceeded 50
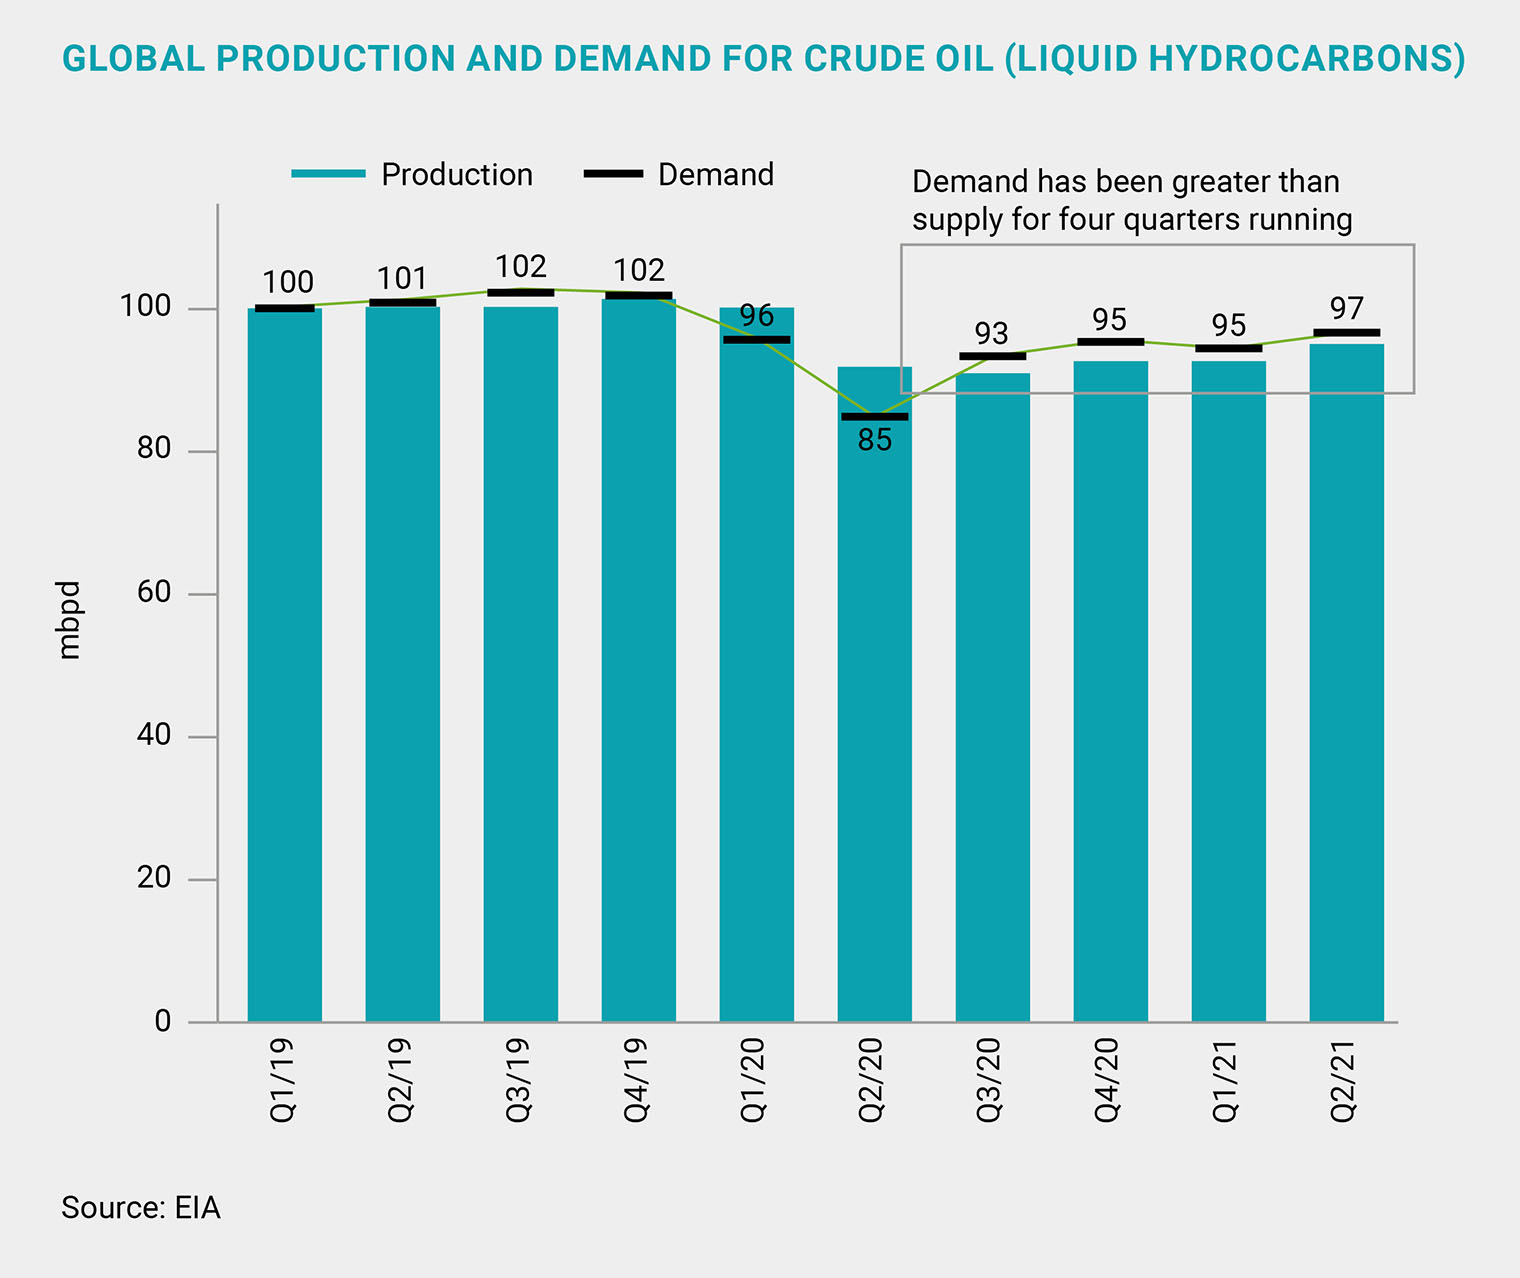
In the second quarter, the average Brent price grew 12% quarter-on-quarter to USD 69 per barrel amid a number of factors. Firstly, demand from end users rose by 2 mbpd. Secondly, non-OPEC+ countries, including US shale oil producers, did not offer any meaningful increase in output. Thirdly, OPEC+ members throughout the second quarter closely followed the growth of demand for oil, never exceeding demand while meeting their commitments to cut output (with quota compliance at around 115% overall). We would like to remind our readers that this April, OPEC+ decided to gradually ease output curbs by 0.7 mbpd between May and June. Moreover, Saudi Arabia rolled back its voluntary extra 1 mbpd cut that was in place between February and April 2021.
As early as December, OPEC+ members plan to ramp up production by 4.1 mbpd compared to April, according to their 18 July 2021 agreement. The document also provides for an option to raise the production baseline for a number of other countries: the UAE rose from 3.16 mbpd to 3.5 mbpd, and Saudi Arabia and Russia increased by 0.5 mbpd (from 11.0 mbpd to 11.5 mbpd, respectively). Throughout the second quarter, there was much talk about the potential lifting of US sanctions against Iran, but the issue remains uncertain. We will keep monitoring the situation.
Petrochemicals: IPEX + 13 p.p.
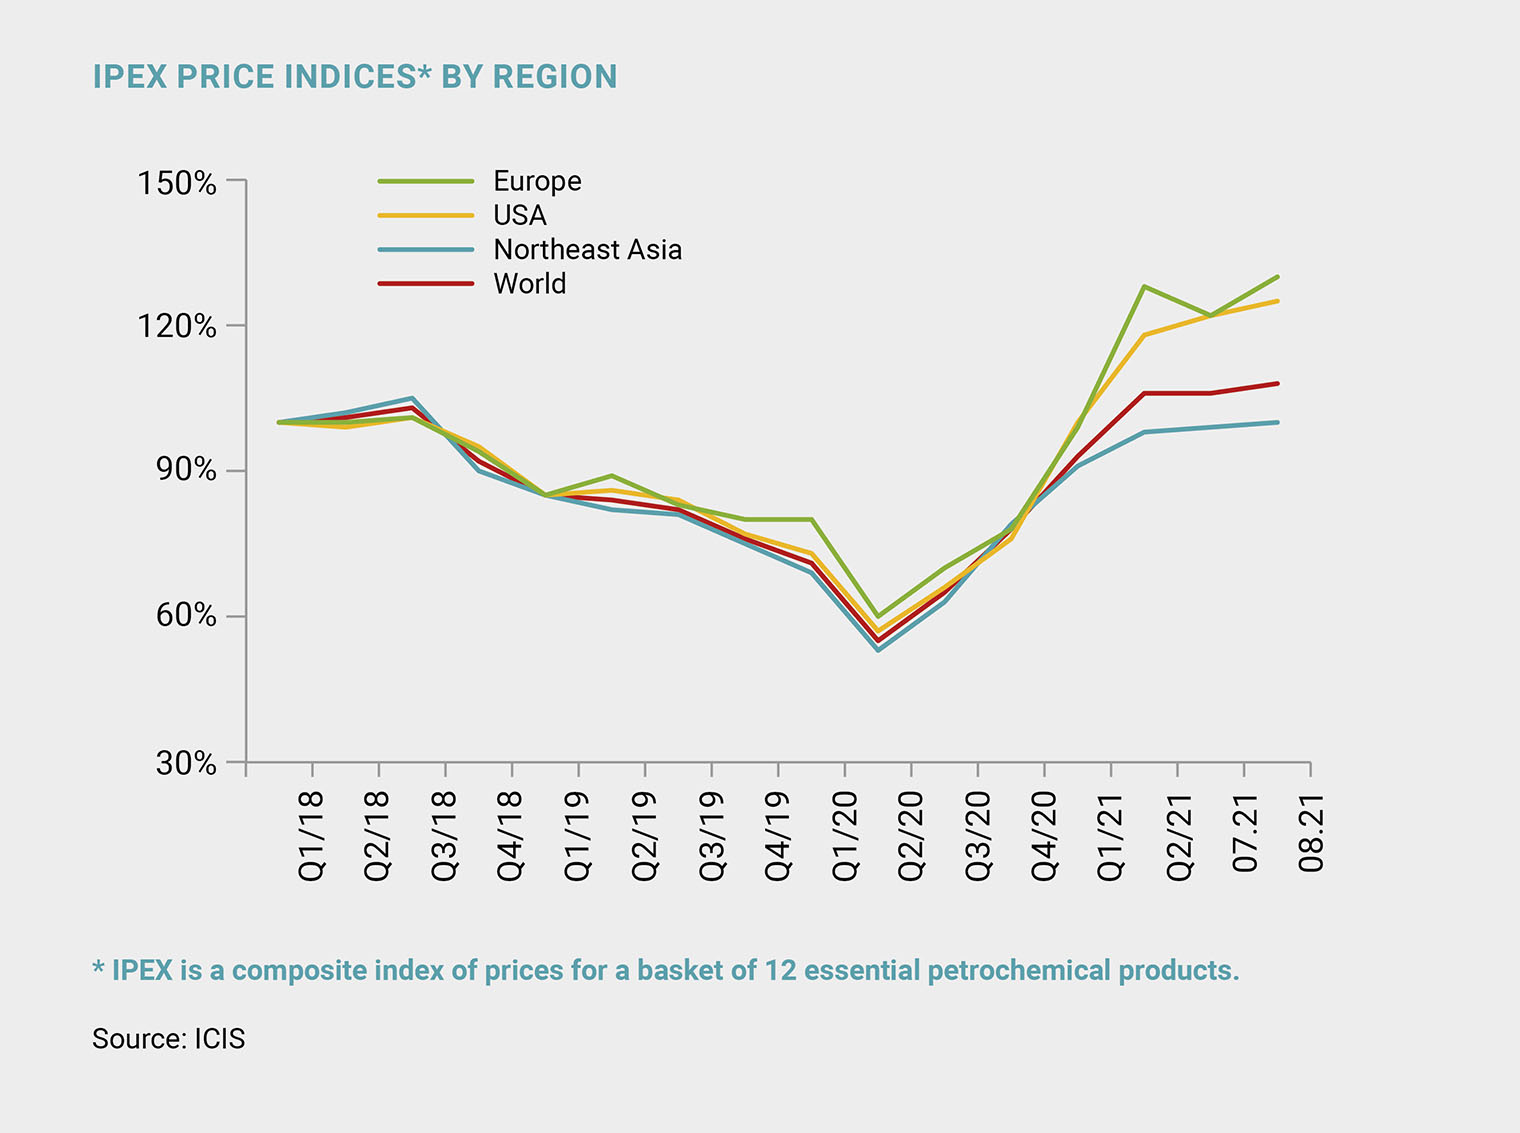
Boosted by the price spike in Europe and the USA, the ICIS Global Petrochemical Index (IPEX, representing the movement of a basket of 12 commodity petrochemical prices across key world regions) grew 13 p.p. quarter-on-quarter in the second quarter, with polyethylene (PE) particularly prominent in the product basket as its price increased 17 p.p. in key global regions.
As early as December, OPEC+ members plan to ramp up production by 4.1 mbpd compared to April, according to their 18 July 2021 agreement
Despite the overall upward trend, the IPEX declined 3% month-on-month in June (down 1% month-on-month in July; up 2% month-on-month in August) primarily due to lower prices for ethylene, benzene and styrene. The chart shows that prices in Northeast Asia grew slower than in other key world regions, primarily due to the continuing high logistics costs and shipping container shortages, as detailed above. In addition, the market was affected by the launch of new ethylene capacity in Asia, specifically in China. In total, over one half of capacity slated for launch in Asia in 2021 was commissioned in 1H 2021, which is expected to result in lower ethylene prices by year-end. Another region that stands out on the chart is Europe, where the price spikes during the second quarter, but also throughout 1H 2021, were caused by massive unscheduled shutdowns. For polyolefins, they exceeded the three-year average in the second quarter, peaking in April.
While leading to stronger imports, the decline in production was not enough to curb price growth. Supplies of polyolefins to Europe from the USA and Saudi Arabia, accounting for close to 50% of European imports on average, were constrained by reduced output in these regions (due to the February storm in the USA and the additional oil output cut of 1 mbpd in Saudi Arabia in February and April).
PE margins are growing
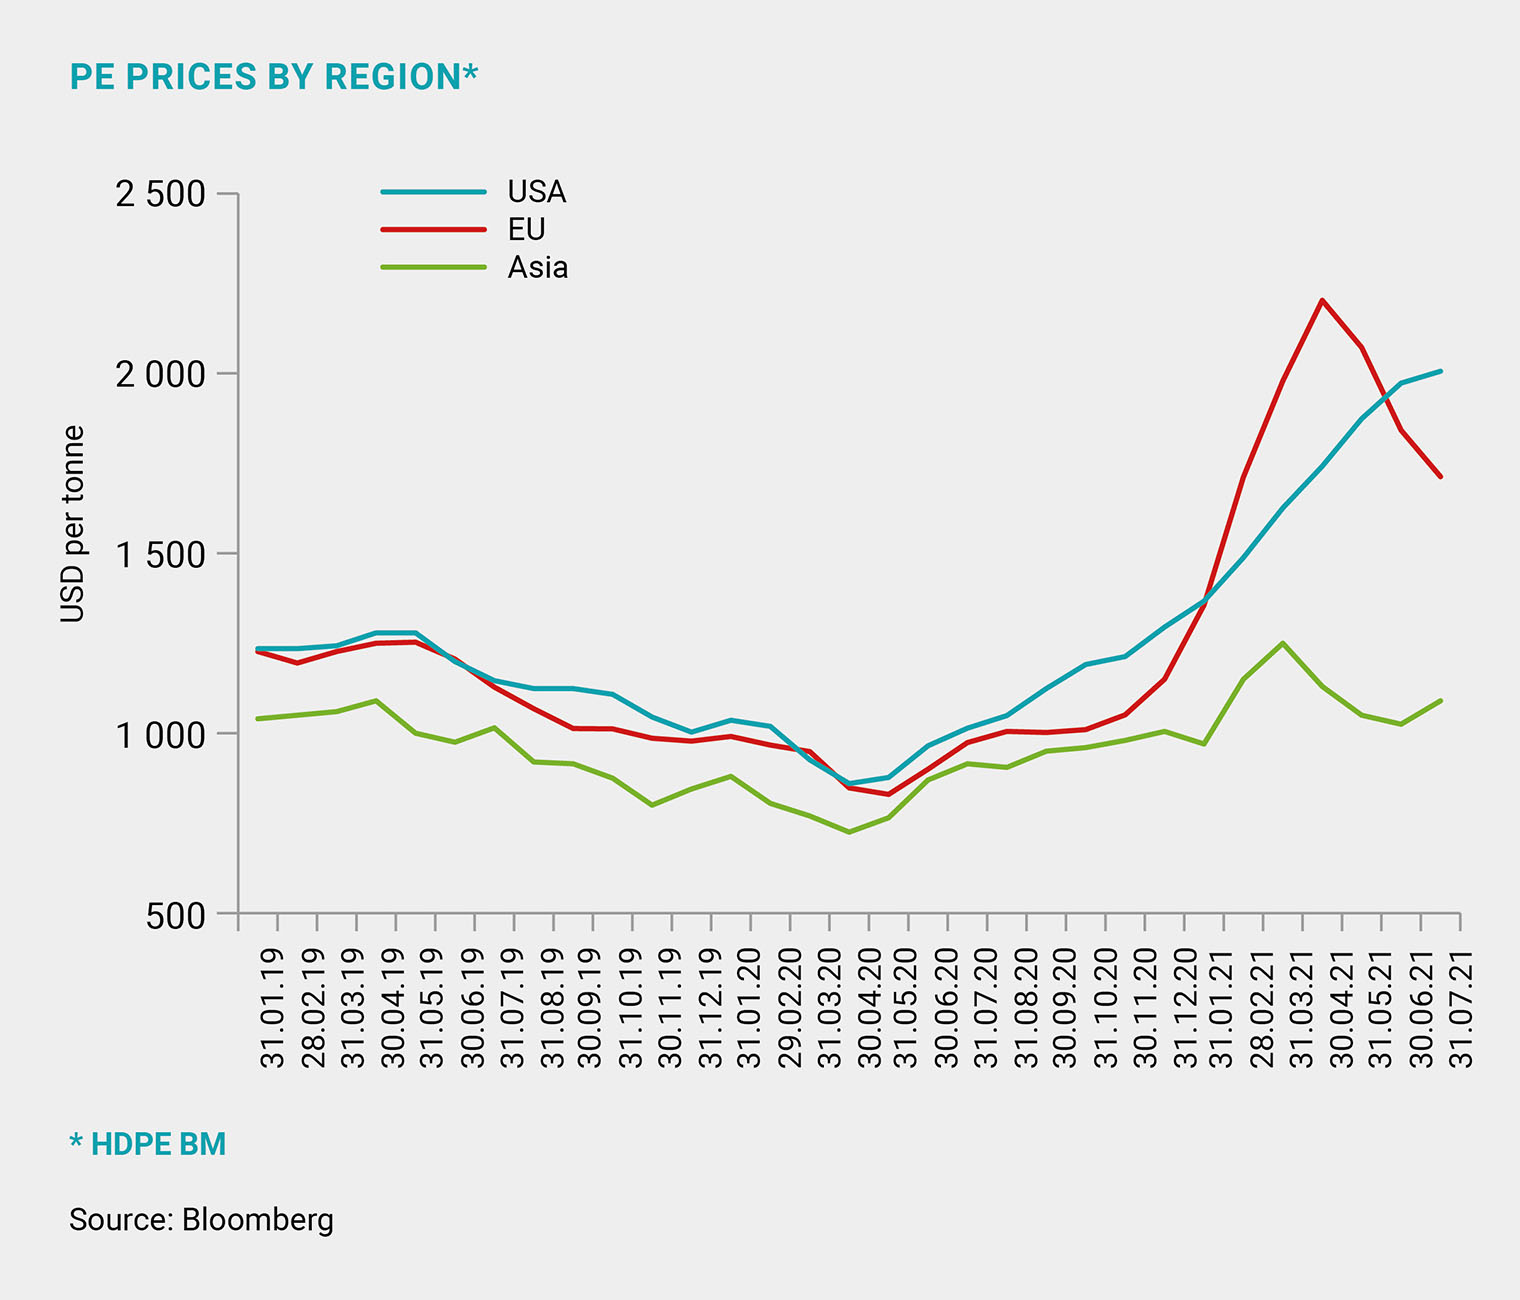
The key highlight in the polyethylene (PE) market in the second quarter was the soaring prices in Europe and the USA (up 21% quarter-on-quarter to USD 1,863 per tonne and up 25% quarter-on-quarter to USD 2,039 per tonne, respectively), resulting in spreads widening by 19% quarter-on-quarter and by 36% quarter-on-quarter, respectively, and further driving a substantial increase in margins.
Boosted by the price spike in Europe and the USA, the ICIS Global Petrochemical Index (IPEX) grew 13 p.p. quarter-on-quarter in Q2 2021, with polyethylene (PE) particularly prominent in the product basket
In the second quarter, the US market was still reeling from the aftermath of the mid-February snow storm. Production took several months to ramp back up to normal utilisation rates, with aging equipment being one of the reasons behind such a sluggish recovery. Leaving aside new capacity built after the Shale Revolution, about half of the 79 PE facilities in 2015 were built before 1983, according to IHS Markit.
Prices in Europe are soaring because of limited imports amid logistical challenges. The price growth in the second quarter – and in the first half of 2021 in general – can be explained by massive unscheduled stoppages throughout the quarter at a scale twice as high as the three-year average, peaking in April. While leading to stronger imports in that very month, the decline in production was not enough to curb price growth. Supplies to Europe from the US and Saudi Arabia, accounting for 60% of European imports, were constrained by reduced output in these regions (due to the February storm in the USA and the additional oil output cut of 1 mbpd in Saudi Arabia in February and April).
Developments observed in the USA had no impact on China, which experienced the opposite trends, with the spread tightening by 12% quarter-on-quarter and production margins down 4% quarter-on-quarter. In the second quarter, the average HDPE BM price index in China was about USD 1,070 per tonne, and up to USD 1,090 per tonne by early September.
The key highlight in the polyethylene (PE) market in the second quarter was the soaring prices in Europe and the USA
The considerable price spread between regions is due to the above-mentioned high cost of logistics and lack of shipping containers. For example, the cost of shipping a 40 ft container from Asia to Europe rose from USD 1,600 in June 2020 to USD 13,000 in late June 2021. In September, shipping a 40 ft container between Shanghai and New York would cost USD 16,138.
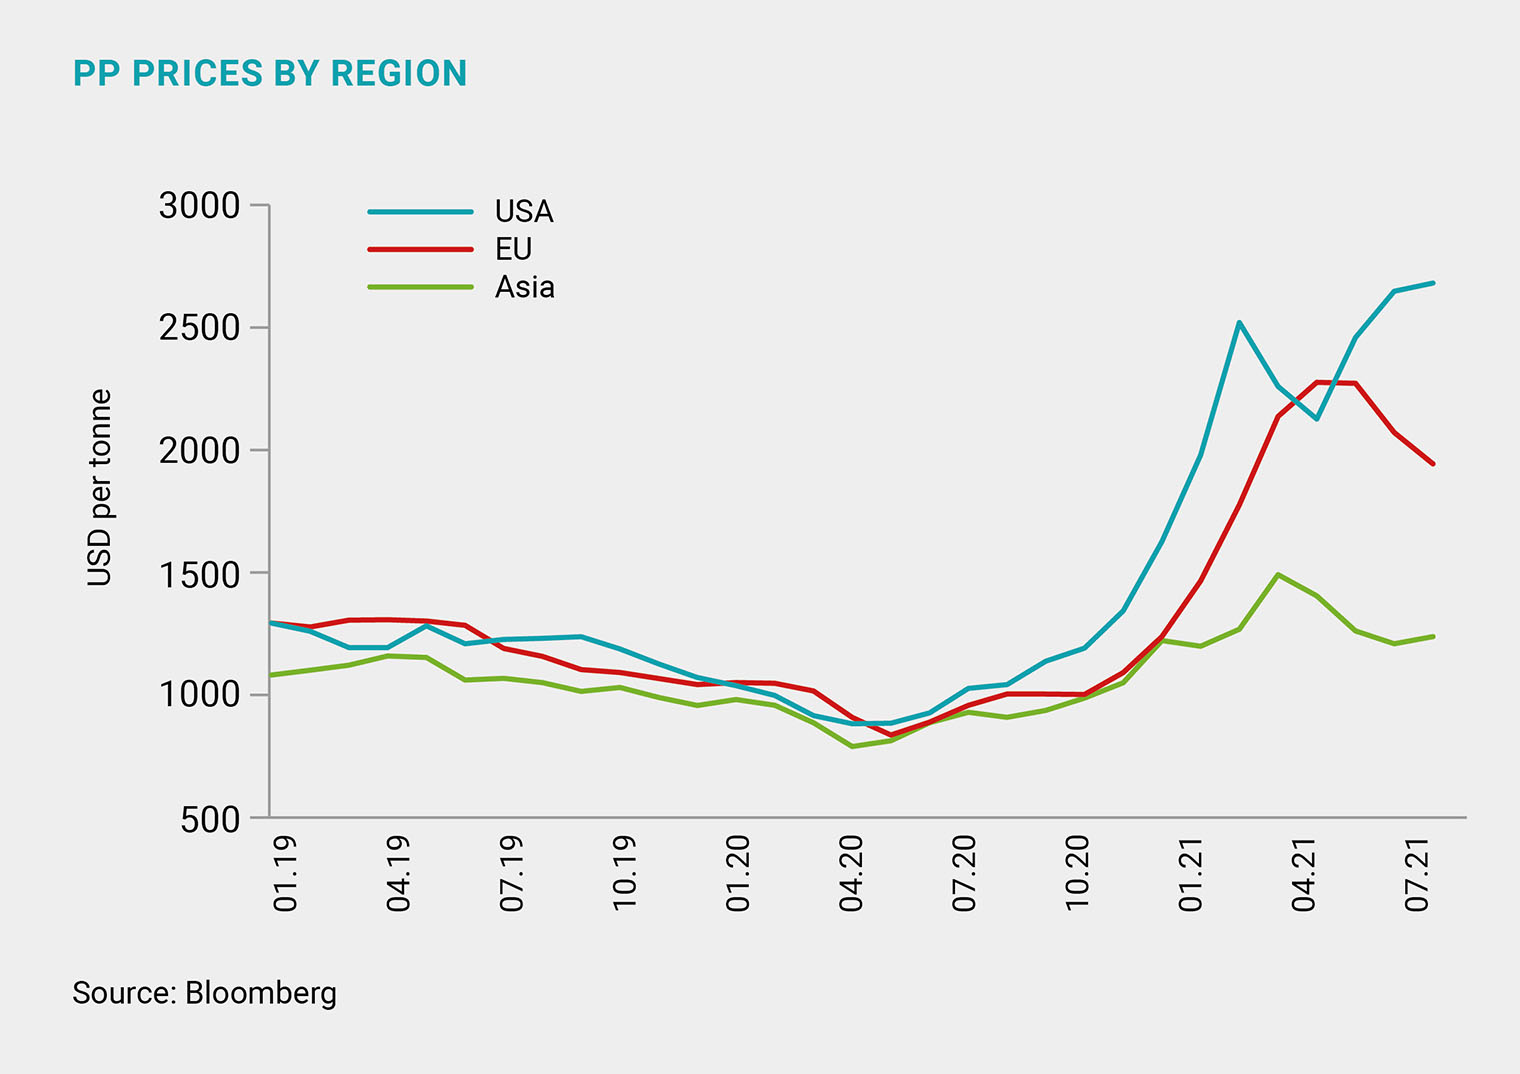
PP: surprise news
Let us first dive into the heart of the matter before covering prices. In 1H 2021, China launched 2 million tonnes of new polypropylene (PP) capacity (43% of the 2021 targets). The news from Europe was totally unexpected: Repsol announced a EUR 657 million investment to expand its plant in Portugal by 300,000 tonnes of polypropylene and 300,000 tonnes of LLDPE, slated to be launched in 2025. The Portuguese government provided the company with EUR 63 million in tax incentives. LyondellBasell launched polyolefin production from plastic waste in Germany. This is an important step toward LyondellBasell’s goal of producing 2 mtpa of recycled polyolefins by 2030.
Spot prices for polypropylene in Q2 increased only in Europe due to a mismatch between supply and demand (up 23% quarter-on-quarter to USD 2,200 per tonne): in the EU, production stoppages were 3.5x higher than the three-year average. The polypropylene–naphtha spread in Europe was about USD 1,600 per tonne (up 30% quarter-on-quarter)
Significant stoppages were also seen in China, where their monthly average over the quarter was 45% higher than the three-year average. This, however, did not help to curb the decline in prices in China, which fell 3% quarter-on-quarter, with the spread tightening by 12% over the same period. The US also saw a decline in prices due to the output recovery after Winter Storm Uri, which took place back in February 2021. The value of PP futures contracts in the US at the end of Q2 2021 averaged USD 2,500 per tonne, rising to USD 2,700 per tonne by early September.
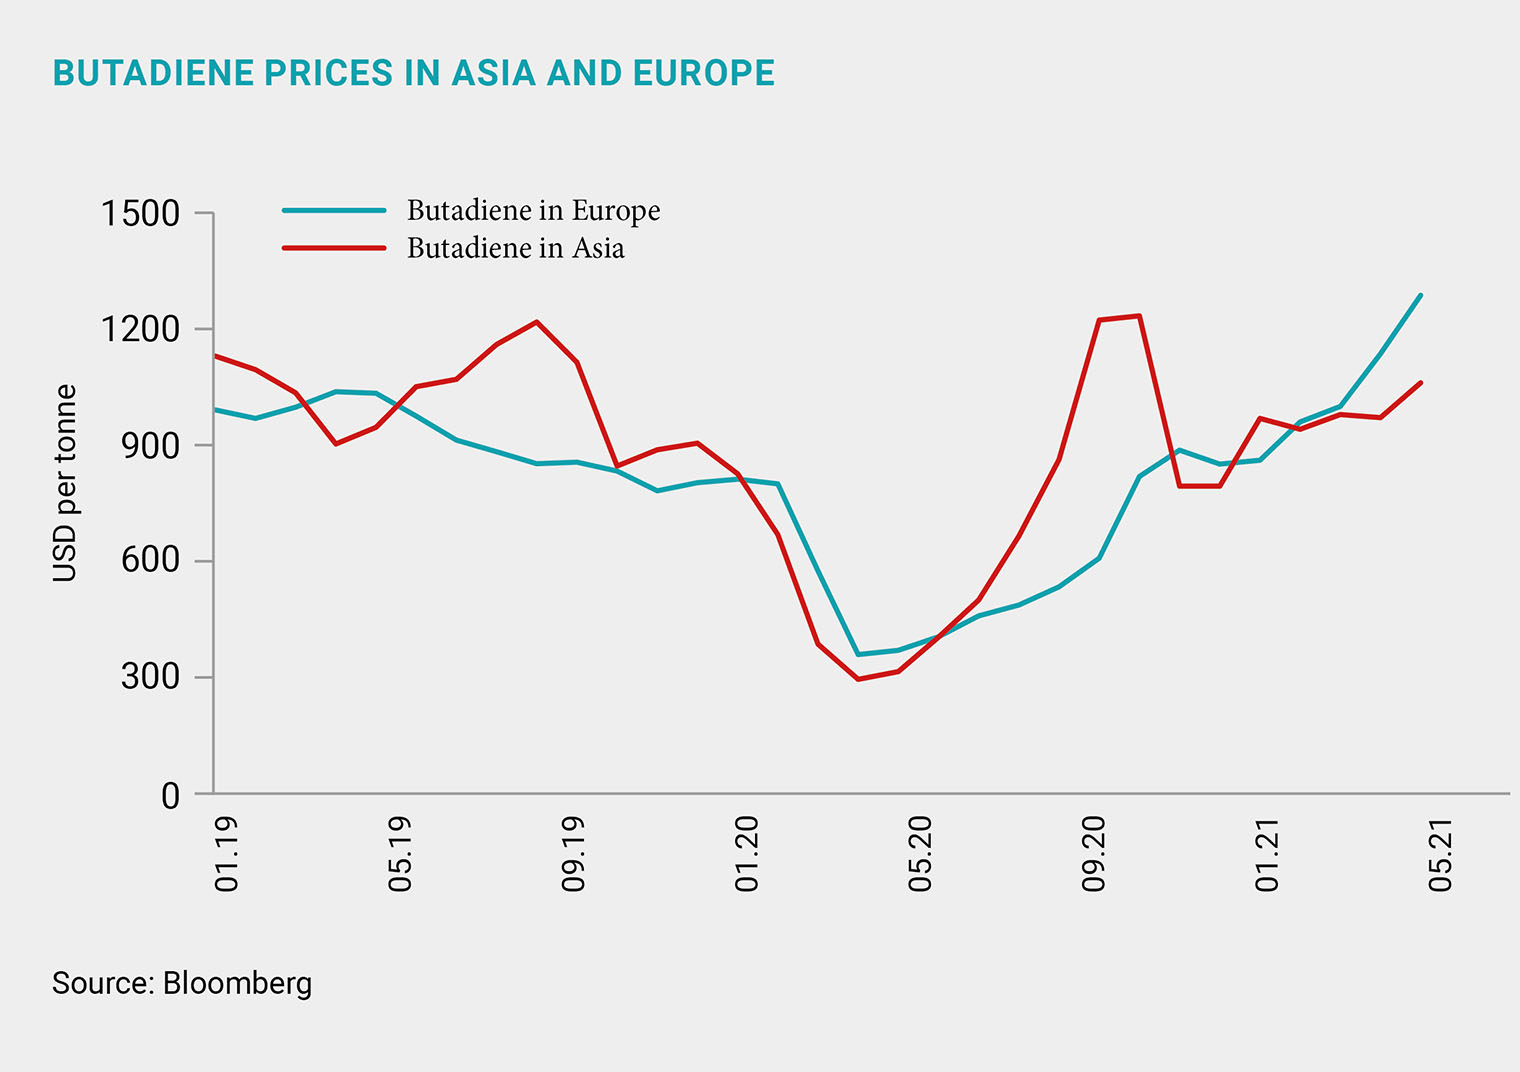
Styrene-butadiene rubbers: fervent growth
In the second quarter, spot prices for styrene-butadiene rubbers rose to USD 1,880 per tonne in Asia (up 5% quarter-on-quarter) and to USD 2,070 per tonne in Europe (up 32% quarter-on-quarter). Butadiene was one of the drivers behind this growth, as it was priced much higher in Europe than in Asia due to strong buying from US customers and a supply squeeze from Europe, eventually leading to a rise in export prices. Notably, the profitability of production in Asia declined due to both higher costs of feedstock and a narrow window to capitalise on the favourable trends in Europe and the USA. Why is this? Because of the very logistical bottlenecks discussed above.
The key highlight of the European market for polyethylene terephthalate was the June introduction of anti-dumping duties on monoethylene glycol for US and Saudi Arabian suppliers, ranging from 8.5% to 52%
On top of growing production costs, rubber prices were impacted by the rise in car manufacturing, which Deutsche Bank estimates to have increased 55% year-on-year in Q2 2021, primarily driven by the low base effect: it was up 163.5% year-on-year in North America and up 108.5% year-on-year in Europe. This growth was partially offset by a production slowdown in China, down 4.6% year-on-year to 5.8 million cars and 24.5 million cars in 2021. The global chip shortage continues to negatively impact car manufacturing. For example, Toyota announced in mid-August that it would cut 40% of its global production targets for September, including its facilities in Japan, but also in North America, Europe, South Asia and China.
PET: duties imposed on MEG
The key highlight of the European market for polyethylene terephthalate (PET) was the June introduction of anti-dumping duties on monoethylene glycol (MEG) for US and Saudi Arabian suppliers. The duties range from 8.5% to 52% and are designed to protect domestic producers. Analysts expect that the anti-dumping laws will not have any major long-term impact on prices in Europe due to increased supplies from Asia instead of the US and Saudi Arabia. For example, MEG supply in Europe is expected to grow as early as in Q4 2021, supported by the launch of 2.6 million tonnes of new Chinese capacity in June (projects by Lianyungang Petrochemical and Zhejiang Petroleum), and Fujian Gulei Petrochemical’s 0.7 mtpa project launched in August.
Download PDF